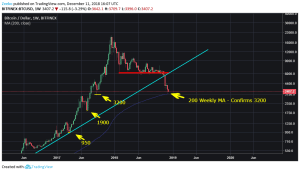
We have almost reached The 200 Weekly MA on the Daily Chart in Bitcoin. It is a level that is frequently tested in the stock markets as well as in Bitcoin. It serves as a major resistance and is tested every now and then. Usually, it stops sell pressure and holds out. If it successfully holds it can serve as the starting point of a new rally. We have come very close to this level and the market has already reversed a bit from there on. The last few days. The question is now whether Bitcoin will continue to drop or if a bottom has formed – at least temporarily.
We have asked this question already at the 4000 level about two weeks ago. At this time, people were already speculating that this would be the bottom. But in our analysis, we had the strong opinion that a further drop is more likely. This analysis still gives you insights on our current situation.
However, in this analysis, we argue that we have found a temporary bottom.
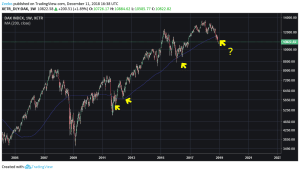
It might be possible that Bitcoin breaks this support but it should hold out for some time. And even if Bitcoin breaks this price, it is not unlikely that the chart will recover fastly. We can take examples from major stock markets like the S&P 500 (fig. 2) or the German DAX (fig. 3). We could take several other examples of individual stocks or assets but this major stock markets give us a good index of important enterprises.
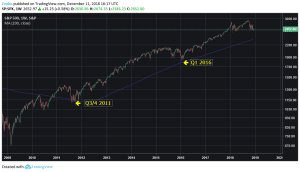
As you can see there are major exceptions to the 200 weekly MA on the daily chart as a support zone. But those often have a historic dimension like the financial crisis in 2008/09 or the DotCom bubble in 2001. Otherwise the 200 weekly MA served as a bottom or if the prices breached this level, they often recovered quickly.
Another side observation here, is that the DAX (fig. 3) is already in a critical zone. The longest bull run after the second World War could likely be coming to an end soon. While the S&P 500 (fig. 1) still looks healthy, the German enterprises do likely indicate that we are moving into a recession. This could also contribute to Bitcoin’s recovery. As people are looking for alternative investment.
The 200 weekly MA on the daily chart is a level where smart money moves in. Often despite the mainstream saying that prices will fall further. This is in fact, so much the case that professional traders can correctly deduce a contrarian signal from general bearish/bullish sentiment.
NewsBTC quotes an analyst that the ‘bear market is far from over‘. CryptoCoinNews suggests that the recent recovery was just a ‘dead cat bounce‘. News.Bitcoin is too afraid to give its own verdict which is why it says that ‘traders are too skeptical to call a bottom.‘. However, none of these analyses take the 200 Weekly MA on the daily chart and the fact that corrective impulse of Bitcoin has eased into account.
Based on this analysis, we deem that it is likely that a bottom has been found for now. A quick recovery in the case of breaching this support should be likely as well as we think it is plausible that smart money watches out for the 200 Weekly MA. However, this does not mean that a rally will start from here on immediately.
If you decide to take the risk at this level set reasonable stop/losses for the case that our analysis was wrong. We hope that this information helps you to develop your own trading strategy.
Disclaimer: This is no financial advice and only serves an informational purpose – DYOR