
Two weeks ago we stated that ‘an outbreak on BTC seems more likely than a continuation of the sidewards movement or a bearish trend’. A prediction that did not occur. However, we are dealing with probabilities and include the possibility of other outcomes into our analysis. This time we have been wrong with the prediction of a tendency. One reason for this outcome seems to have been the hash war between the Bitcoin Cash forks Bitcoin Cash (ABC) and Bitcoin Cash SV that sparked uncertainty in traders. We reported as one of the first websites about the breakdown of the markets and its likely correlation to the hash war.
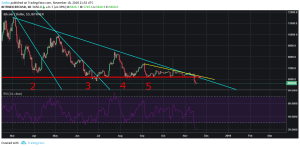
Our first chart (fig. 1) clearly shows that we have broken the major support line at around $6000. The support held ever since the correction in Bitcoin started in December 2017. This means that the Bitcoin market has fallen back to the level of October 2017, the lowest point in over a year. Currently, the Relative Strength Index indicates that BTC is currently strongly oversold. In fact, except for Bitcoin Cash all major cryptocurrencies are slightly recovering from the breakdown. A bounce back is very likely. However, the likeliness that we regain the support level soon seems small.
As we likely have entered the bear market right now, the Fibonacci analysis gives us little insight for now. The loss of the major support will triggered a major sell-off that will continue for days if not even weeks. As miners and long-time hodlers want to realize their profits or want to protect themselves from further losses, it is very unlikely that we will recover any time soon. Miners have on-going costs which is why they will continue to sell if they continue to mine right now. The old support line is now a major resistance line and even staying above this level for some time would still not mean that we are in a safe zone. For buyers to regain control we would have to recover to above $6500 zone. Almost $2000 away and with two major resistance lines at $6000 and $6500 it seems to be most unlikely.
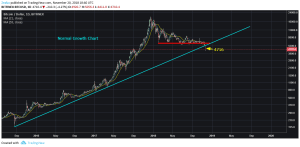
A look at the normal growth chart (fig. 2, fig. 3) provides us with another bearish outlook. Would we have seen this level earlier in September or October this year, the normal growth chart would have told us to closely watch the $5000 level that could potentially have served as a second major support line. It would have indicated that Bitcoin would have corrected in a sustainable manner. The fact that we have reached this level much later and in a decisive moment has caused this massive sell-off.
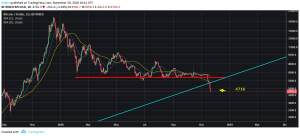
The normal growth-chart, however, tells us that good buying opportunities await us as soon as Bitcoin finds a bottom. The question is where can we expect this bottom to be at?
Psychological levels are of course the levels at $4000, $3000, $2000 etc. However, when this bear market started not even a week ago the price crashed through the once stable resistance at around $6000 in no time and took the $5000 with it a few days later. Psychological levels are currently not respected. Therefore, we have to look for other potential support zones.
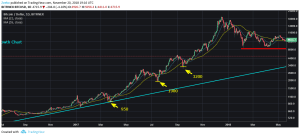
However, those levels are just suggestions and levels to watch, where you could set price alerts in addition to the psychological levels.
A valuable insight of this crash is the fact that we cannot rely solely on the means of technical analysis as some other analysts claim. However, this does not mean that we have to listen to any expert that claims that Bitcoin is going to break down for this or that reason. Rather, the trick is to recognize developments that are so substantial that they could trigger the market in either way.
Therefore, the development of the new Bitcoin Cash client and the performance of the BCH chart are recommended to watch.
DISCLAIMER: THIS IS NO TRADING ADVICE AND SERVES ONLY INFORMATIONAL PURPOSES.