Table of Contents
Exploring the Potential Surge in Bitcoin Prices Amidst Volatility Signals
Bitcoin’s value has been a subject of intense speculation and analysis within the financial and cryptocurrency communities. Recent analyses, especially those exploring volatility signals such as the Bollinger Bands, suggest that Bitcoin (BTC) could be on the verge of a significant price increase. In this article, we will delve into the factors contributing to these predictions, the role of Bollinger Bands in forecasting Bitcoin’s price, historical precedents, and the potential future of Bitcoin in the financial market.
Understanding Bitcoin’s Volatility Signals
The Role of Bollinger Bands
Bollinger Bands are a key technical analysis tool used by traders to gauge market volatility and predict potential price movements. These bands consist of a middle line, typically the simple moving average (SMA) over a certain period, and two outer bands that reflect volatility. When the bands contract, it indicates low volatility, while expansion suggests higher volatility. It’s during these periods of contraction that Bitcoin has historically seen significant price movements.
Historical Analysis of Bollinger Bands and Bitcoin
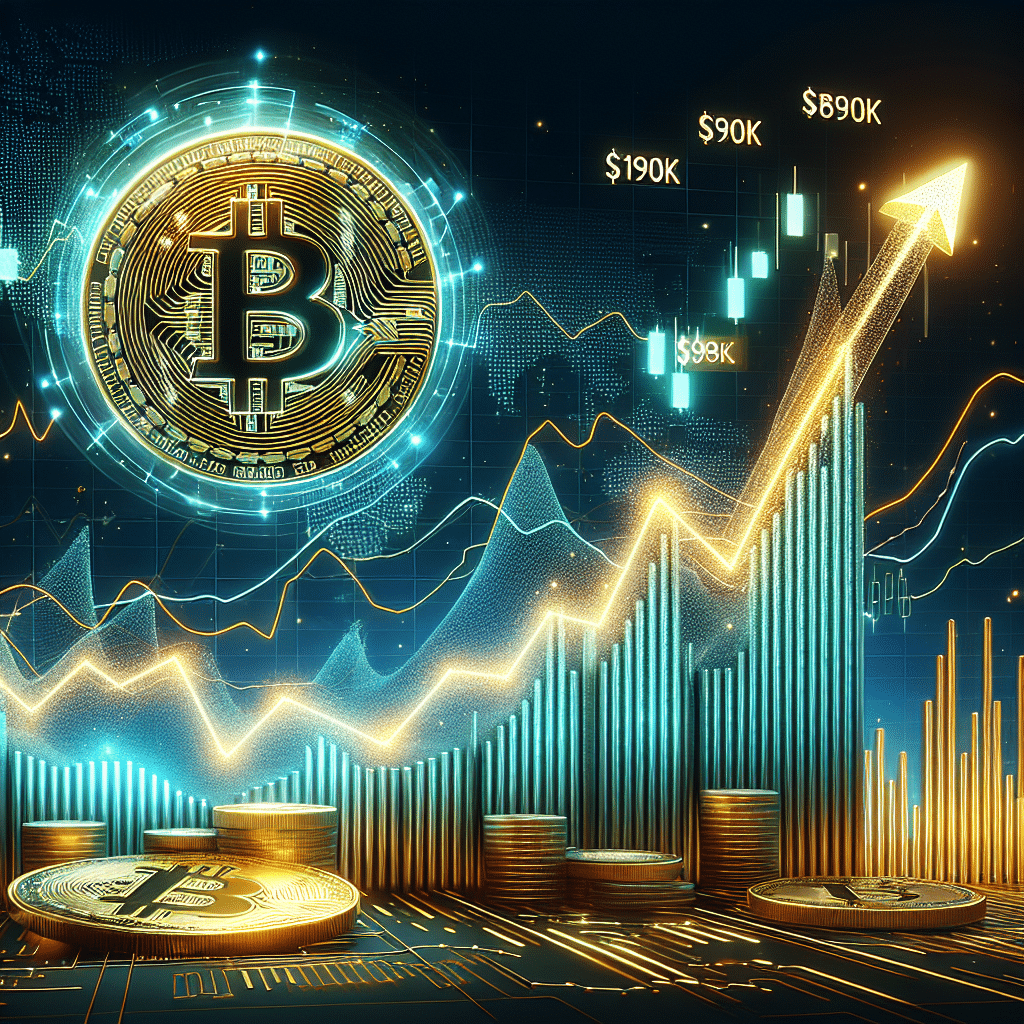
Julien Bittel of Global Macro Investor points out a distinct pattern where Bitcoin’s price surged following periods of compressed Bollinger Bands. Notably, April 2016 and July 2023 exhibited such compressions, followed by an impressive uptick in Bitcoin’s value. Bittel speculates that we may be on the brink of another such breakout, with potential targets ranging between $140,000 to $190,000 based on past patterns.
Examining Past Bull Markets and Predicted Breakouts
History’s Lessons on Bitcoin’s Potential
Bitcoin’s journey through its bull and bear markets offers critical insights into its potential future movements. The digital currency has witnessed substantial rallies following periods of consolidation and reduced volatility, as outlined in previous analyses. July 2023’s stance, akin to past pre-rally phases, positions Bitcoin for a possible repeat of history according to experts like Bittel.
The September Breakout Phenomenon
The pattern of Bitcoin’s behavior in past cycles unveils September as a pivotal month for breakouts. Drawing from historical data, the anticipation builds for a repeat scenario where Bitcoin could emerge from its re-accumulation range by September 2024, as suggested by the trader Rekt Capital. Such patterns offer a blueprint for predicting Bitcoin’s potential road to recovery and bullish run.
The Influence of External Factors
Bitcoin ETFs and Market Sentiment
The launch of the United States spot Bitcoin exchange-traded funds (ETFs) is highlighted as a significant milestone contributing to local price highs. Bitcoin ETFs wield considerable influence over Bitcoin price dynamics, far outstripping effects from other sectors like mining. Research supports the disproportionate impact these financial instruments have on market sentiment and Bitcoin valuation.
Institutional Accumulation versus Retail Participation
A divergence is noted in the investment behavior between institutions and whales versus the general retail investor public. While the former group exhibits accumulation behavior, indicative of a bullish outlook, the latter’s tepidity reflects a missing element in the current market cycle. This disparity in investment strategies underscores a nuanced landscape for Bitcoin’s potential ascent.
FAQs
What are Bollinger Bands?
Bollinger Bands are a technical analysis tool used to measure market volatility and predict potential price movements. They consist of a middle line (SMA) and two outer bands that expand and contract based on market volatility.
Why is September considered significant for Bitcoin’s breakout?
Historical data shows that Bitcoin has exhibited patterns of breaking out from periods of consolidation in September, making it a month watched closely by investors for potential significant price movements.
How do Bitcoin ETFs influence Bitcoin’s price?
Bitcoin ETFs provide a regulated and accessible means for institutional and retail investors to invest in Bitcoin, thus having a profound impact on Bitcoin’s demand and price. Their launch and acceptance can significantly boost market sentiment and Bitcoin’s value.
Should individual investors consider these volatility signals?
While Bollinger Bands and other volatility signals provide valuable insights, individual investors should conduct thorough research and possibly consult financial advisors before making investment decisions due to the inherent risks of cryptocurrency investments.
Conclusion
Bitcoin’s potential for a significant price surge, grounded in volatility signals like Bollinger Bands and historical precedents, presents a compelling narrative for investors. However, the landscape is nuanced, with institutional behaviors and upcoming financial products like Bitcoin ETFs swaying the market dynamics. As September 2024 approaches, all eyes will be on Bitcoin to see if history does indeed repeat itself, propelling its value to new all-time highs. As always, potential investors should navigate these predictions with caution, informed by comprehensive research and a balanced perspective on risk.
For detailed insights into Bollinger Bands and their application in market analysis, consider visiting Investopedia’s Bollinger Bands guide.