Fundamental Analysis vs Technical Analysis

Fundamental and technical analysis offer two very different ways to look at markets. This guide breaks down how each method works and how to apply them effectively.
On this page
Market participants don’t speak the same analytical language. Some rely on earnings reports, central bank statements, and long-term trends. Others stare at charts, looking for breakouts, reversals, and volume spikes. These are not just different techniques; they reflect different views of how markets behave and where to find an edge.
The choice between fundamental and technical analysis isn’t just theoretical. It shapes how traders see opportunity, manage risk, and react to uncertainty. One approach studies value; the other focuses on price.
Understanding both is useful not only for choosing a strategy, but also for recognizing how others operate. This article outlines how each method works, where they differ, and how some traders combine them to make more balanced decisions.
A Guide to Fundamental vs. Technical Analysis
When evaluating financial markets, traders and investors often turn to two distinct approaches: fundamental and technical analysis. These methods differ in what they measure, how they interpret data, and what kind of decisions they support. Understanding the contrast helps explain why one strategy focuses on earnings and interest rates, while the other relies on charts and price patterns.
Fundamental analysis focuses on estimating an asset’s intrinsic value. It considers financial statements, economic indicators, industry outlook, and even factors like management quality. A company’s revenue growth, debt levels, or changing interest rates can all influence its valuation. Investors use this approach to spot assets trading below their true worth. It is generally preferred by those who invest with a long-term view and are less concerned with short-term market moves.
Technical analysis takes a different route. It assumes that price already reflects all relevant information, and that future movements can be anticipated by studying past price action. Traders examine charts, trend lines, and technical indicators such as RSI or Moving Averages. The goal is to identify patterns or signals that suggest when to enter or exit a trade. Price levels where assets tend to reverse, such as support and resistance zones, are a key focus.
The choice between fundamental vs technical analysis depends largely on the trader’s objective. If the goal is to build a portfolio based on business value and growth potential, fundamental analysis is likely a better fit. If the goal is to take advantage of short-term swings and optimize entry points, technical analysis offers more relevant tools. Each method has its strengths and limitations.
Comparing fundamental and technical analysis helps clarify how traders make decisions and manage risk. While one approach asks what to buy, the other focuses on timing. Many professionals combine both to get a fuller picture of the market and improve their chances of success.
How Fundamental Analysis Works
Fundamental analysis is based on the idea that every asset has an intrinsic value that can be estimated using real-world data. This approach looks at financial reports, economic indicators, industry conditions, and company-specific metrics to understand what an asset should be worth. Investors study income statements, balance sheets, and cash flow to measure a company’s profitability, stability, and growth potential.
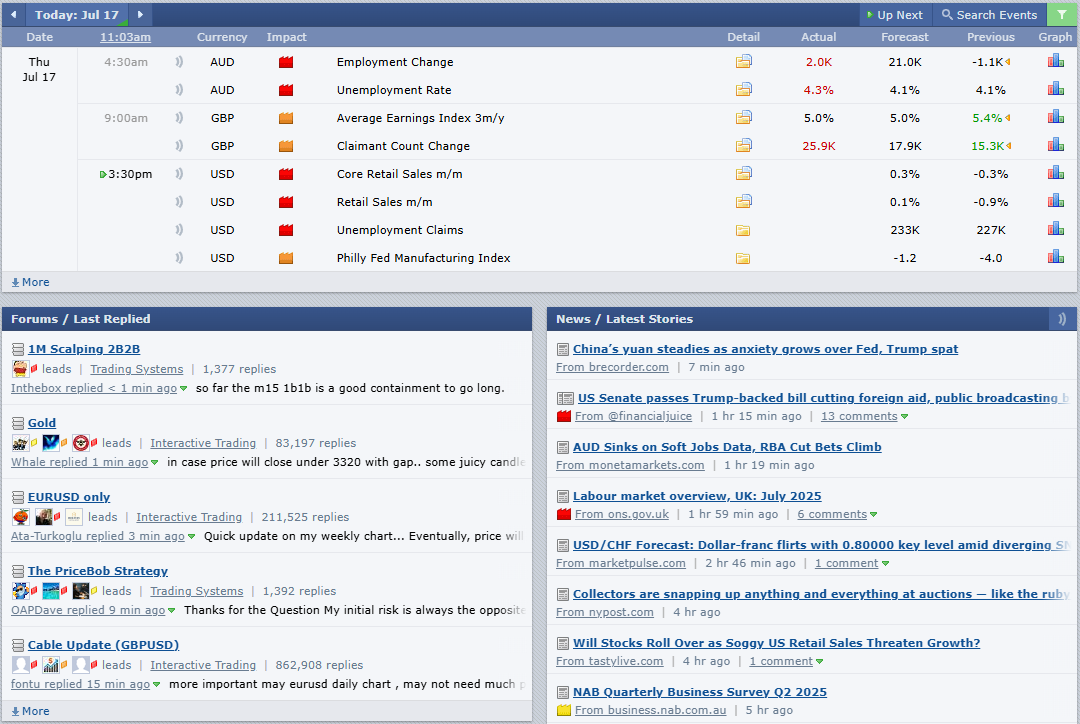
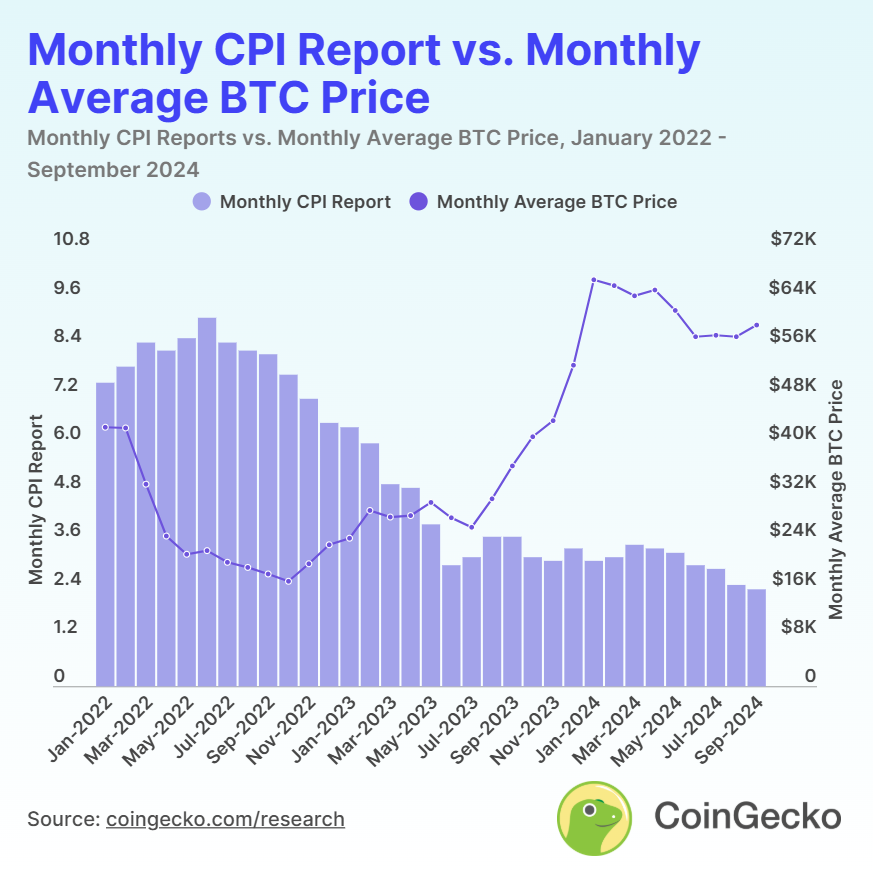
Macroeconomic data also plays a key role. Interest rates, inflation, and employment levels shape the broader environment in which companies operate. These factors can influence consumer demand, capital costs, and investor expectations. Industry trends and regulatory developments offer additional context, helping analysts assess how external forces may affect business performance.
Company-specific factors include management quality, brand strength, and competitive position. These qualitative elements, while harder to quantify, often make a difference when comparing two companies in the same sector. Analysts might review public filings, listen to earnings calls, or track product announcements to evaluate a company’s direction and execution.
Fundamental analysis is often used for long-term investing. It supports decisions such as whether to buy and hold a stock, add it to a portfolio, or avoid it altogether. A stock trading below its calculated fair value may be viewed as an opportunity, while one trading far above it might be considered overhyped or overpriced.
There are many tools available to support this work. Platforms that aggregate economic news help analysts stay updated on relevant developments. Financial ratio analysis – such as P/E, debt-to-equity, or return on equity – is widely used to compare companies and identify strengths or weaknesses. All of these inputs feed into the valuation process.
This method requires time, research, and interpretation, but it helps investors make decisions grounded in real performance rather than market noise. When done well, fundamental analysis helps identify overlooked assets with strong potential or warns against investments built on shaky financials.
How Technical Analysis Works
Technical analysis is a method of evaluating assets by studying historical market data, primarily price and volume. The core idea is that past trading activity can reveal patterns that help forecast future movements. Traders believe that price action reflects all known information, so instead of digging into financial reports, they focus on how the market behaves.
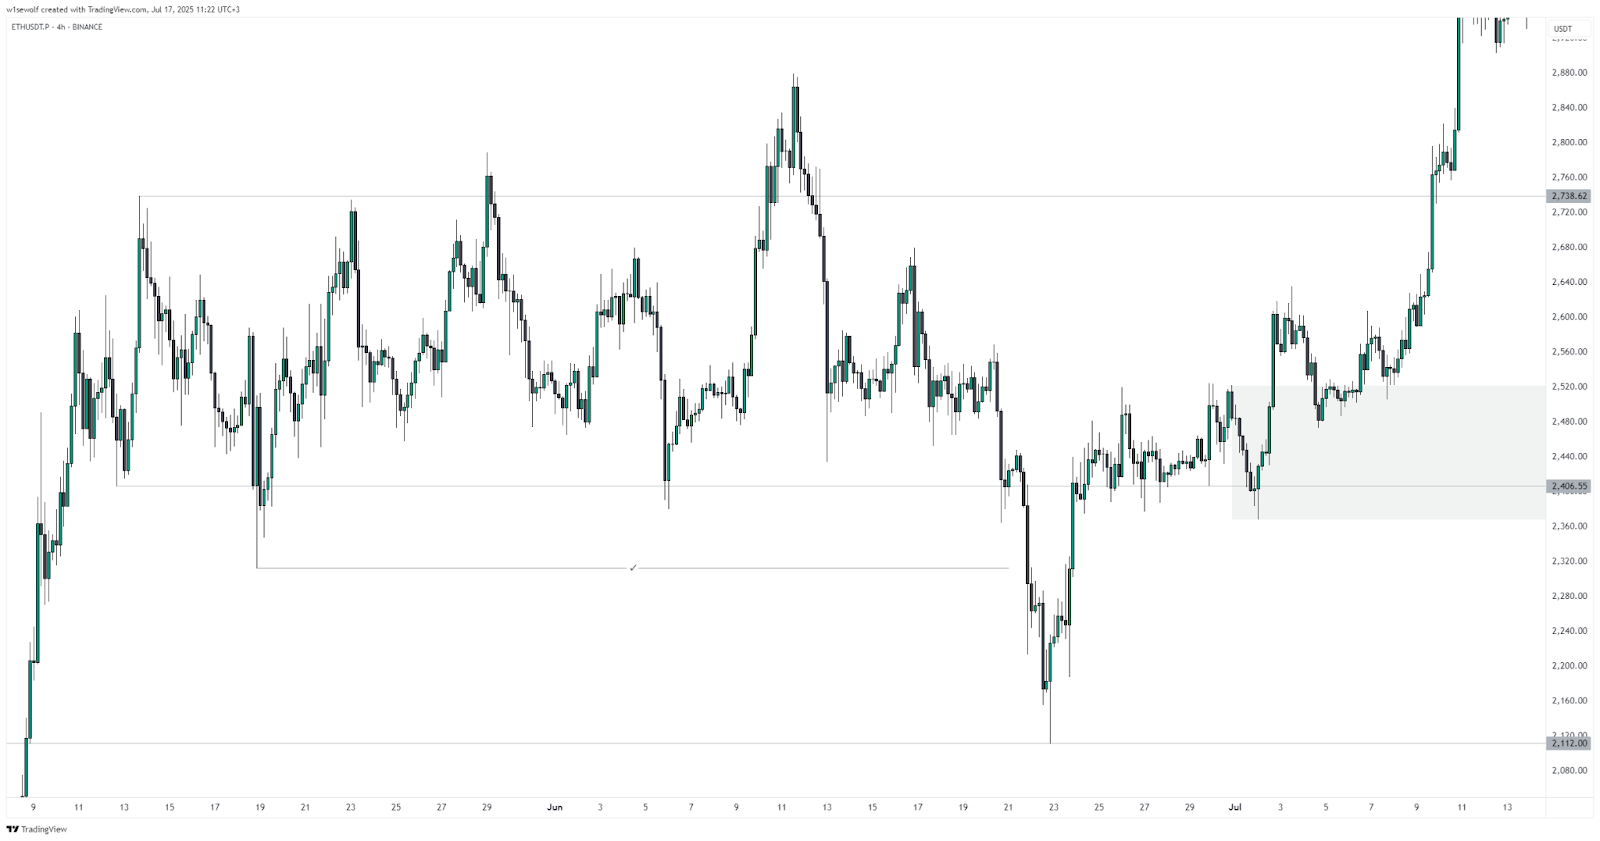
At the center of technical analysis are charts. These visual tools display how an asset’s price has moved over time. Traders look for trends, patterns, and signals that repeat. For example, a price forming higher highs and higher lows might indicate an uptrend. Common chart types include line charts, bar charts, and the widely used candlestick charts, which reveal open, high, low, and close prices in a given period.
Support and resistance levels are another key element. These are price points where the asset tends to reverse or stall. Support acts as a floor, resistance as a ceiling. Traders use them to decide where to enter or exit a trade. When a price breaks through one of these levels, it can signal a shift in market sentiment.
Technical indicators add another layer. Moving averages smooth out price data to reveal trends more clearly. The Relative Strength Index (RSI) helps identify overbought or oversold conditions. Bollinger Bands measure volatility. These tools don’t guarantee outcomes but help traders make more informed decisions.
Patterns like head and shoulders, triangles, and flags also play a role. These shapes form on charts and are thought to precede specific price movements. While no pattern works every time, experienced traders use them alongside other tools to build context.
Unlike fundamental analysis, which looks at what to buy, technical analysis is focused on when to buy or sell. It’s widely used by short-term traders, including day traders and swing traders, who seek to capitalize on momentum and quick shifts in price. Timing, not long-term value, is the priority.
Technical analysis requires discipline, attention to detail, and practice. It works best when paired with proper risk management and a clear strategy. Though it relies on past data, many traders consider it essential for navigating fast-moving markets.
Finding the Right Approach for Your Trading Style
Choosing between fundamental analysis vs technical analysis starts with understanding personal goals, timeframe, and appetite for risk. These two methods serve different purposes, and selecting the one that matches the overall strategy helps maintain consistency in trading or investing. Some market participants rely entirely on one approach, while others combine both depending on context and asset class.
Fundamental analysis works best for those focused on long-term outcomes. It suits investors who care more about where an asset may be months or years from now, rather than short-term fluctuations. This method involves studying business models, earnings growth, debt levels, and broader economic signals such as inflation and interest rates. Investors who use fundamentals often evaluate whether an asset is underpriced relative to its true value or if its industry outlook supports sustained growth. For long-term portfolios that can absorb short-term volatility, fundamental analysis offers a strong foundation.
Key features of fundamental analysis:
- Uses financial statements, earnings reports, and macroeconomic data.
- Focuses on long-term value and structural trends.
- Common among investors with extended holding periods.
Technical analysis, by contrast, prioritizes short- and medium-term price action. It appeals to those who aim to benefit from movements in the market regardless of an asset’s fundamental strength. Technical traders rely on indicators such as moving averages, RSI, and chart patterns to interpret market behavior and identify potential entry and exit points. This method assumes that all available information is already priced in, so price action becomes the main signal for decision-making.
Key features of technical analysis:
- Relies on chart patterns, volume, and historical price data.
- Targets short-term movements rather than intrinsic value.
- Often used by day traders, scalpers, and swing traders.
Some prefer to blend both approaches to balance macro context with tactical precision. For instance, fundamental analysis may help identify quality assets, while technical signals can assist in timing trades more effectively. This combined strategy reduces blind spots and helps filter out emotional decisions driven by either market hype or fear.
The difference between fundamental analysis and technical analysis is not about superiority. It depends on how each method supports the broader trading plan, personality, and tolerance for risk. Consistency with the chosen approach and alignment with strategy and time horizon is more important than the method itself.
How to Use Both Analysis Methods Together
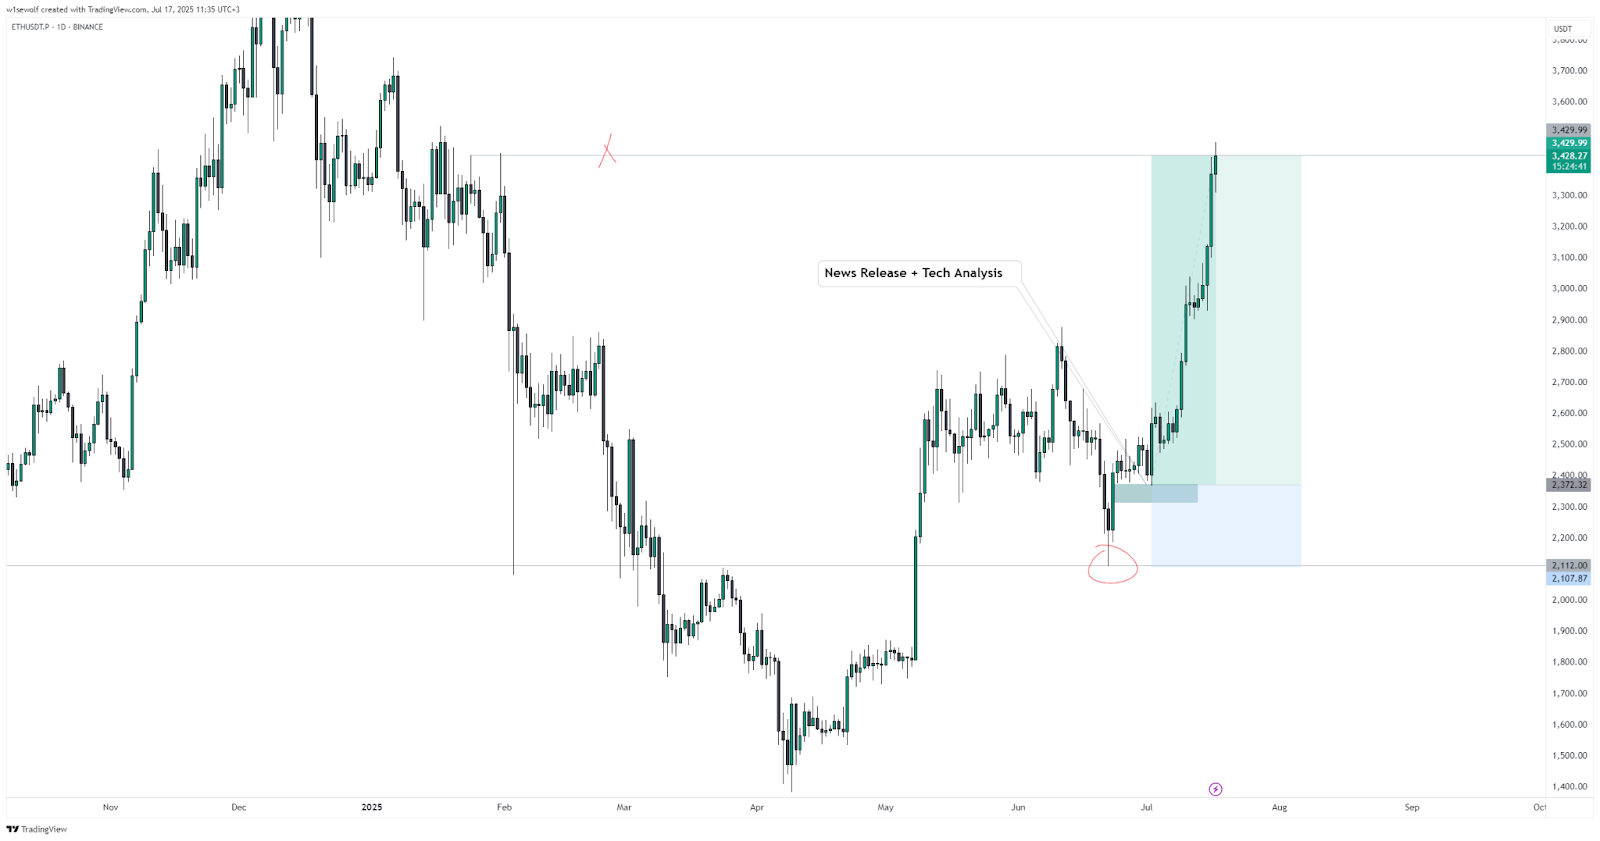
Combining technical and fundamental analysis allows traders and investors to make more informed decisions by viewing the market from two complementary angles. Each method covers what the other misses. Fundamental analysis explains why an asset is worth buying, while technical analysis helps determine when to act. This blend improves accuracy, reduces uncertainty, and adds structure to the decision-making process.
Fundamental analysis gives a long-term perspective. It highlights the underlying value of an asset based on earnings, economic outlook, or sector performance. An investor might identify a stock that looks undervalued based on cash flow, profit margins, or macro conditions. However, even a solid asset can underperform in the short term if broader sentiment or market structure is against it.
That’s where technical analysis comes in. By studying chart patterns, price momentum, and trend strength, traders can better time entries and exits. If a fundamentally strong asset shows a breakout on rising volume, or bounces off a key support level, that confirmation adds confidence. This coordination between the two methods limits exposure to random market noise and helps avoid premature decisions.
Using technical and fundamental analysis together can also support risk management. While fundamentals help define long-term conviction, technicals offer short-term signals for setting stop-loss levels, position sizing, or re-entry zones. For example, a trader might exit a position not because the fundamentals changed, but because the technical structure broke down, signaling a shift in sentiment or liquidity.
Some strategies rely more on one method than the other, but many professional traders integrate both. Long-term investors may monitor technical indicators before scaling into positions. Short-term traders may use earnings results or macro data as filters to avoid betting against fundamentals. This cross-checking helps align conviction with timing.
The main benefit of combining these methods is balance. Fundamentals provide direction. Technicals provide timing. Together, they increase clarity and reduce blind spots. This approach requires more effort and discipline but often results in a better understanding of market dynamics and stronger execution.
By not relying solely on one framework, traders can adjust more confidently to changing conditions. The market rarely moves for one reason alone. A flexible approach grounded in both logic and behavior can lead to more consistent outcomes.
The information published on CoinRevolution is intended solely for general knowledge and should not be considered financial advice.
While we aim to keep our content accurate and current, we make no warranties regarding its completeness, reliability, or precision. CoinRevolution bears no responsibility for any losses, errors, or decisions made based on the material provided. Always do your own research before making financial choices, and consult with a qualified professional. For more details, refer to our Terms of Use, Privacy Policy, and Disclaimers.
Articles by this author